One of the most critical shortcomings of many processes is their inability to easily report on and
explore the data. Indeed less than half of the organisations conducting face to face
interviews have access to any reporting at all. On-boarding, stay and exit interviews are rich sources of
information about how to attract and retain the best people but without the
tools to explore the information the opportunity to make a difference
is lost.
"The Interview Group's proprietary suite of online reporting
tools have been designed by an experienced HR practitioner for HR practitioners."
These tools are available in the cloud 24/7 and deliver the reports to you in PDF or MS Excel in
seconds so you can use the tools as if they were an application on your desktop. You'll
be able to find the answers you need when you need them - be it for a last minute
request from senior management, a regular report for the board or an exploration of
the issues facing a specific part of your organisation.
Four types of reports are at your finger tips:
Individual Reports – Contain all the information collected
during the interview in a format that makes it easy to identify the real exit
reasons (exit interviews) or potential exit reasons (on-boarding and stay
interviews) and identify the ‘red flags’ for issues facing
other employees.
Standard Group Reports – A statistical summary of all the interview
responses for any employee segment.
Custom Reports – For more advanced users who want to answer specific
questions, for example:
what are the biggest flight risk factors for our
current top performers?
why do our top performing females leave?
what were
the key issues for those leaving with less that 2 years tenure?
how many
people who leave for career advancement go to a more senior position?
what
aspects of our recruitment and selection process need improvement?
which employees are experiencing bullying and harrassment?
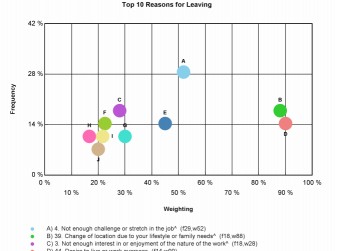
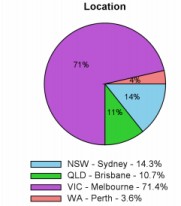
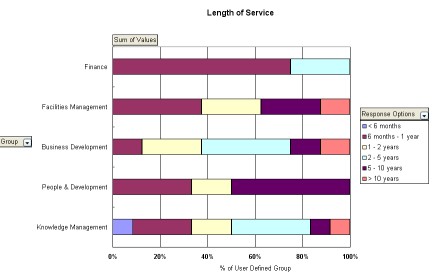
Power Reports – The power of MS Excel’s pivot table functionality allows you to
compare the interview responses of multiple groups on the
same chart. For example see how the reasons for leaving vary by age or tenure on
a single chart.
Here are some samples of the types of charts you can include in your reports.
Interested to know more? Contact us
for a detailed demonstration.